Best Cpk Calculation: Top 5 Tools Compared
Finding the Best Cpk Calculation: An Introduction
Finding a reliable and effective online tool for Cpk calculation can be quite challenging. With numerous options available, each claiming to offer the best results, it’s easy to feel overwhelmed. Cpk, or the process capability index, is a critical metric used in quality management and Six Sigma methodologies to assess how well a process meets specified limits. As businesses and professionals increasingly rely on data-driven insights, the importance of using a trustworthy Cpk calculator cannot be overstated. A precise calculation can lead to informed decision-making and improved operational efficiency.
This article aims to simplify your search by reviewing and ranking the top online tools for Cpk calculation. By examining a variety of options, we will help you identify the tools that best meet your needs, ultimately saving you time and effort. Whether you are a Six Sigma practitioner, quality control manager, or simply someone interested in process improvement, finding the right Cpk calculation tool is essential for achieving accurate results.
To ensure a comprehensive evaluation, we have established clear criteria for ranking these tools. Key factors include accuracy of calculations, user-friendliness, additional features offered (such as support for Cp calculations, graphical representations, and export options), and the overall reputation of the tool within the quality management community. By focusing on these aspects, we aim to provide a well-rounded overview that will assist you in selecting the most suitable Cpk calculation tool for your specific requirements.
Our Criteria: How We Selected the Top Tools
Criteria for Selecting the Best Cpk Calculation Tools
When evaluating online tools for Cpk calculation, we established a set of criteria that prioritize user experience, functionality, and reliability. Here’s how we determined the top tools in this category:
-
Accuracy and Reliability
– The primary function of a Cpk calculator is to provide accurate results based on the input data. We assessed each tool’s ability to produce reliable calculations for various scenarios, ensuring they adhere to the correct formulas for Cpk and Cp. This includes evaluating how the tools handle statistical data, such as mean, standard deviation, and specification limits. -
Ease of Use
– A user-friendly interface is crucial for both beginners and experienced users. We looked for tools that offer intuitive navigation, clear instructions, and helpful prompts. The ability to enter data easily and understand the results without needing extensive statistical knowledge is essential for a positive user experience. -
Key Features
– The best Cpk calculators include essential features such as:- Input Fields for Data: Users should be able to input the process mean, upper specification limit (USL), lower specification limit (LSL), and standard deviation.
- Visual Representations: Tools that provide graphical representations of the normal distribution and process capability indices can enhance understanding.
- Explanatory Notes: Helpful descriptions and explanations of results can aid users in interpreting their Cpk values effectively.
- Comparison Options: Some tools allow users to compare multiple Cpk values side by side, which can be beneficial for process improvement analysis.
-
Cost (Free vs. Paid)
– We considered the cost of using each tool, weighing the benefits of free calculators against those of paid options. While free tools may suffice for basic calculations, we also explored premium tools that offer advanced features and support. The value provided by paid options was assessed in relation to their pricing. -
Additional Resources and Support
– Tools that offer additional resources, such as guides, tutorials, or customer support, were favored. Access to educational content can significantly enhance user understanding and application of Cpk calculations, making the tool more valuable in practical settings. -
Compatibility and Accessibility
– We evaluated whether the calculators are accessible on multiple devices, including smartphones and tablets. A responsive design that works seamlessly across various platforms ensures that users can perform calculations whenever necessary.
By applying these criteria, we aimed to present a well-rounded selection of Cpk calculation tools that cater to a wide range of user needs, from novices seeking basic calculations to professionals requiring in-depth analysis and reporting capabilities.
The Best Cpk Calculations of 2025
2. Process Capability Analysis Cp, Cpk, Pp, Ppk
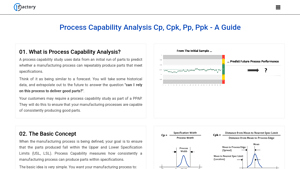
The Process Capability Analysis tool from 1Factory.com offers a comprehensive guide to understanding key metrics such as Cp, Cpk, Pp, and Ppk, which are essential for evaluating process performance. The tool emphasizes that a higher Cpk indicates a more capable process, while values below 1.0 signal inadequacy. This resource is designed to help users assess and improve manufacturing processes by interpreting these critical capability indices effectively.
- Website: 1factory.com
- Established: Approx. 20 years (domain registered in 2005)
3. Process Capability (CP And CPK) Index Calculator

The Process Capability (CP and CPK) Index Calculator from Learn Lean Sigma is a valuable tool designed to assess the capability of a manufacturing process. By inputting specific limits, mean, and standard deviation, users can easily calculate the Cp and Cpk indices, which provide insights into how well a process meets specification requirements. This calculator is essential for quality control professionals seeking to enhance process performance and consistency.
- Website: learnleansigma.com
- Established: Approx. 3 years (domain registered in 2022)
How to Get the Most Accurate Results
Double-Check Your Inputs
When using online calculators for Cpk calculations, the accuracy of your results hinges significantly on the data you input. Before submitting your information, take a moment to review each entry. Ensure that your upper specification limit (USL), lower specification limit (LSL), process mean, and standard deviation are all correct. A simple error in any of these values can lead to misleading results. It’s also a good practice to confirm that the units of measurement are consistent throughout your inputs, as discrepancies can lead to inaccurate calculations.
Understand the Underlying Assumptions
Every online calculator operates under certain assumptions about the data and the distribution. For Cpk calculations, it is typically assumed that the data follows a normal distribution. Familiarize yourself with these assumptions as they can significantly affect the validity of your results. If your data does not meet these assumptions, consider using transformation techniques or alternative methods to better reflect the true nature of your process. Additionally, understanding the difference between Cp and Cpk, as well as when to use each, can help you select the right tool for your needs.
Use Multiple Tools for Comparison
To ensure the reliability of your results, consider using more than one online Cpk calculator. Different tools may have slight variations in their algorithms or methods of calculation, which can lead to differing outputs. By comparing results from multiple calculators, you can identify any discrepancies and choose the most reasonable outcome. This practice not only enhances the credibility of your findings but also provides you with a broader perspective on your process capability.
Familiarize Yourself with Statistical Concepts
Having a basic understanding of the statistical concepts involved in Cpk calculations can significantly improve your experience with online tools. Familiarize yourself with terms such as standard deviation, process mean, and specification limits. Knowing how these elements interact will help you interpret the results more effectively and make informed decisions based on your findings. Resources such as textbooks, online courses, or articles can provide valuable insights into these concepts.
Document Your Process
As you use online calculators, keep a record of the inputs you use and the results you obtain. This documentation can be invaluable for future reference and analysis. By tracking your calculations over time, you can identify trends in your process capability and make informed decisions about potential improvements. Additionally, having a well-documented history allows for easier audits and reviews, should you need to revisit your calculations in the future.
Seek Expert Guidance When Necessary
If you encounter difficulties or uncertainties while using online calculators, don’t hesitate to seek help from more experienced colleagues or professionals in the field. Engaging with a community of practice can provide you with insights and tips that can enhance your understanding and use of these tools. Online forums, professional networks, or local workshops can serve as excellent resources for learning and sharing knowledge about Cpk calculations and process capability analysis.
Frequently Asked Questions (FAQs)
1. What is Cpk and why is it important in process capability analysis?
Cpk, or Process Capability Index, is a statistical measure that indicates how well a process meets its specification limits. It assesses both the process mean and variability, providing insight into whether a process is capable of producing products within specified limits. A higher Cpk value suggests better process performance, meaning fewer defects and higher quality output. Cpk is crucial for organizations aiming to maintain quality standards and improve manufacturing processes.
2. How is Cpk calculated?
Cpk is calculated using the following formula:
[ Cpk = \min\left(\frac{USL – \text{Mean}}{3\sigma}, \frac{\text{Mean} – LSL}{3\sigma}\right) ]
Where:
– USL is the upper specification limit
– LSL is the lower specification limit
– Mean is the average of the process data
– σ (sigma) represents the standard deviation of the process data
This formula takes into account the distance from the process mean to the nearest specification limit, normalized by the process variability.
3. What is the difference between Cp and Cpk?
Cp and Cpk are both measures of process capability, but they focus on different aspects. Cp measures the potential capability of a process without considering its centering relative to specification limits; it only looks at the spread of the process. In contrast, Cpk accounts for both the spread and the centering of the process, making it a more accurate representation of how well a process is performing relative to customer requirements. Cpk will always be less than or equal to Cp, as it incorporates the effect of any shift in the process mean.
4. What are good Cpk values, and what do they indicate about process performance?
Cpk values provide a benchmark for assessing process performance:
– Cpk < 1: Indicates that the process is not capable of producing output within specification limits, leading to a high likelihood of defects.
– Cpk = 1: Suggests that the process is just meeting the specifications, with a risk of producing defective items.
– Cpk ≥ 1.33: Generally considered acceptable for most industries, indicating that the process is capable of producing quality products with a low defect rate.
– Cpk ≥ 2: Indicates an excellent process capability, with very few defects likely to occur.
Higher Cpk values are preferable as they indicate better quality and consistency in the output.
5. Can Cpk be used for all types of processes?
Cpk is most effective for processes that are stable and in statistical control, meaning that the process variation is consistent over time. For new processes or those undergoing significant changes, Ppk (Process Performance Index) is often used instead, as it measures the performance of the process based on actual data without assuming statistical control. Thus, while Cpk is a valuable tool for assessing mature processes, it may not be suitable for evaluating processes in the early stages of development or those with high variability.
Important Disclaimer
⚠️ Important Disclaimer
The information and reviews in this guide are for educational purposes only and are based on publicly available information. We are not affiliated with any of the tools mentioned. Features and pricing may change. Always conduct your own research before choosing a tool for your needs.